How to Check Memory Usage on CentOS/RHEL
Linux has different set of commands to check the usage of memory. The free command shows the total amount of free and used physical and swap memory in the system, as well as the buffers used by the kernel. It is important to check memory usage so that resources do not fall short and users are able to access the server. Suppose a website is running form a webserver, then we require enough memory to serve the visitors to the site. If we have not enough memory then the site would become very slow or even go down when there is a traffic spike, simply because memory would fall short.
![]()
/proc/meminfo
You can check memory usage is to read the /proc/meminfo file. The same file is used to know the free and other utilities report of free and used memory (both physical and swap) on the system.
# cat /proc/meminfo
or
# egrep --color 'Mem|Cache|Swap' /proc/meminfo
Sample Output:
MemTotal:        7996284 kB
MemFree:         5415608 kB
Cached:            92416 kB
SwapCached:        35924 kB
SwapTotal:       8187836 kB
SwapFree:        8059332 kB
free command
free command displays the total amount of free and used physical and swap memory in the system, as well as the buffers used by the kernel.
# free -m
Sample Output:
             total       used       free     shared    buffers     cached
Mem:          7808       2828       4980          6         37        100
-/+ buffers/cache:       2689       5119
Swap:         7995        124       7871
Note:
-b,-k,-m,-g: show output in bytes, KB, MB, or GB
-l: show detailed low and high memory statistics
-o: use old format (no -/+buffers/cache line)
-t: display total for RAM + swap
-s: update every [delay] seconds
-c: update [count] times
vmstat command
vmstat reports information about processes, memory, paging, block IO, traps, and cpu activity.
# vmstat
Sample Output:
procs -----------memory---------- ---swap-- -----io---- --system-- -----cpu-----
 r  b   swpd   free   buff  cache   si   so    bi    bo   in   cs us sy id wa st
 0  2 127504 4907616  57828 114252    0    0   327   507   24   22  3  0 82 15  0
The vmstat command with the s option, lays out the memory usage statistics much like the proc command.
# vmstat -s
Sample Output:
      7996284  total memory
      3028732  used memory
      2587708  active memory
       253600  inactive memory
      4967552  free memory
        32212  buffer memory
        97732  swap cache
      8187836  total swap
       127572  used swap
      8060264  free swap
      2629730 non-nice user cpu ticks
          890 nice user cpu ticks
       335618 system cpu ticks
     80671997 idle cpu ticks
     14269700 IO-wait cpu ticks
            8 IRQ cpu ticks
        12963 softirq cpu ticks
            0 stolen cpu ticks
    320259348 pages paged in
    496267028 pages paged out
        40038 pages swapped in
        85154 pages swapped out
    151875583 interrupts
    278983792 CPU context switches
   1438090342 boot time
       300883 forks
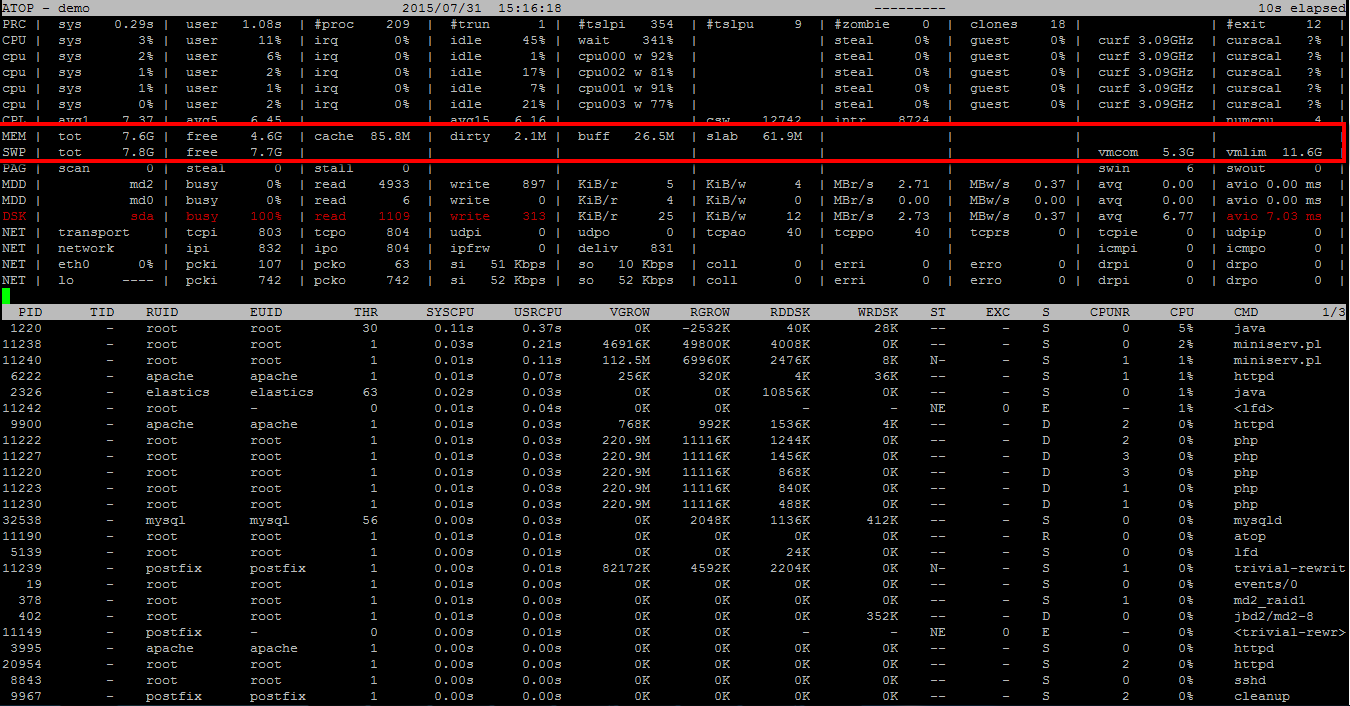
atop command
The program atop is an interactive monitor to view the load on a Linux system. This program can display the amount of used and free memory, i.e. cpu, memory, disk and network.
# atop
Sample Output:
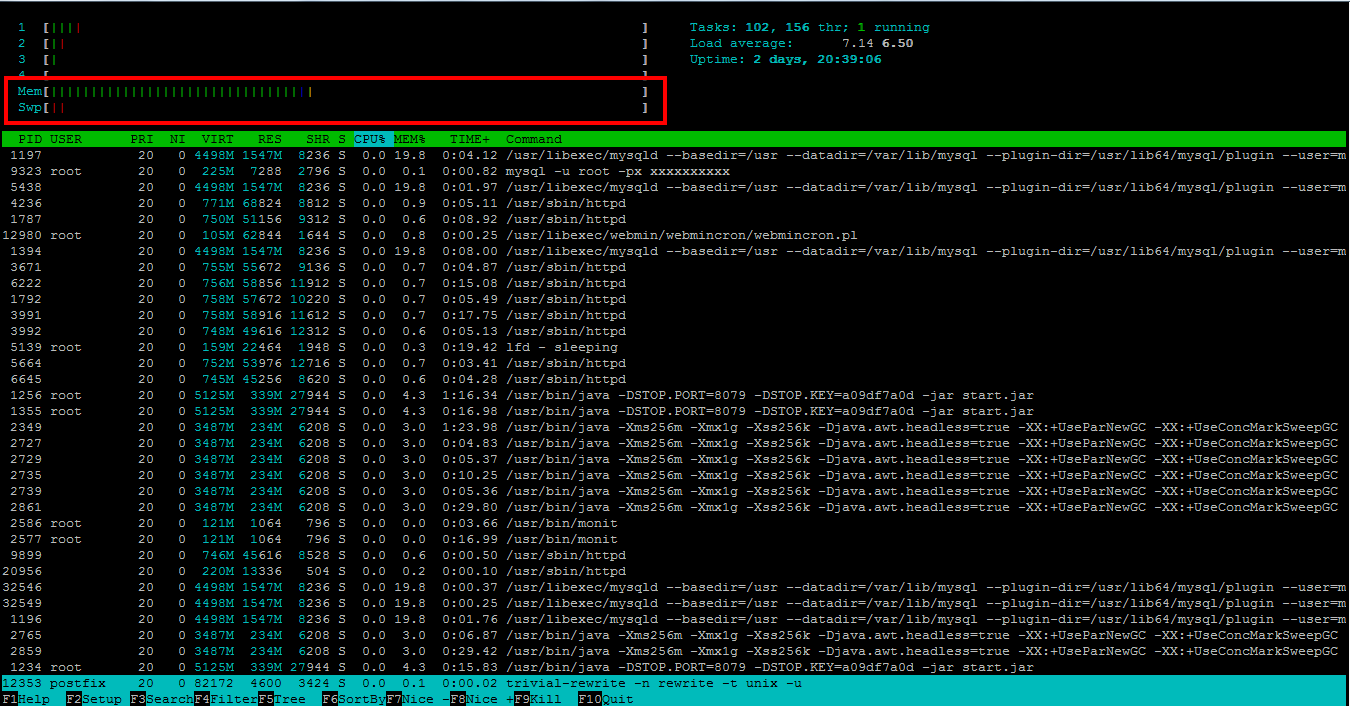
htop command
It is similar to top, also allows you to see all the processes running on the system, with their full command lines.
# htop
Sample Output:
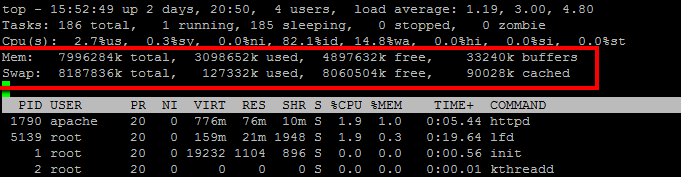
top command
The top command show a real-time view of a running system. It can also display system summary information as well as a list of tasks currently being managed by the Linux kernel.
# top
Sample Output: